| Bhutan
- Ethnic Groups & People |
| Bhutanese household income |
 |
Bhutan People |
|
|
Bhutan Information |
|
|
 |
| How
Bhutanese households spend and earn
|

|
Bhutanese
spent almost one third of their income in meeting rental, energy and household
operation expenses according to the 2003 Bhutan Living Standard Survey prepared by the National Statistical Bureau.
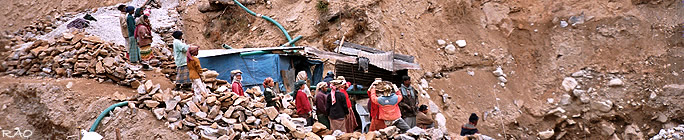
Saktenpas
who come with their caravan of horses and yaks to carry their food stock
take three days to reach home as the animals find it difficult to climb
the steep rock-strewn path.
Rental
expenses
household
energy |
13
%
12
% |
| Miscellaneous
expenditure |
10
% |
food
expenses
-rice
and dairy products
-meat
and vegetables |
37
%
14
%
3
% |
alcoholic
beverages
-urban
areas
-rural
areas |
>2
%
>1%
3
% |
| tobacco
and doma |
>1
% |
|
| furnishing
and equipment |
5
% |
| transport,
communications |
<5
% |
| health |
>2
% |
| education |
>
3% |
| household
income |
|
-farming
-salary
and wages
-private
businesses
-remittances
-pensions
-others |
46
%
34
%
8.4
%
2.5
%
0.2
%
6
% |
|
Rental
expenses
household
energy
household
operation
recreation |
13
%
12
%
>3
%
1
% |
| monthly
household consumption expenditure |
Nu.
7,362 |
| -urban
areas |
Nu.
11,100 |
| -rural
areas |
Nu.
6,250 |
|
Rentel
expenses by itself was about 13 % and household energy use (which
includes electricity, gas, kerosene and firewood) around 12 % and household
operation costs more than 3 %.
Clothing
and footwear took up about 10 %, furnishing and equipment about
5 % and transport and communications less than 5 %.
Miscellaneous
expenditure which figures at more than 11 % has not been specified
but could include items like expenses on buying vehicles and land in the
urban areas and cattle and agricultural tools in the rural areas.
With health
and education provided free by the government, expenses in these areas
was under 2 % and 3 %. Expenses on recreation was the lowest at
1 % on the national average and about 2.5 % in the urban areas.
On food
expenses which was about 37 % of overall expenditure, about 14 % was
spent in equal measure on rice and dairy products indicative of the Bhutanese
dietary habits. An average 3 % each was spent on meat and vegetables and
a little over 2 % on alcoholic beverages. Expenses on alcohol figure less
than one % in urban areas and nearly 3 % in the rural Bhutan. Consumption
expenditure on tobacco and doma figure less than one % (0.84 %).
According
to the survey more than 81 % of the categorised food items were imported
including import of rice and dairy products which was almost 55
%. Over 90 % of the fish, tea and coffee, cooking oil and non alcoholic
beverages consumed were imported.
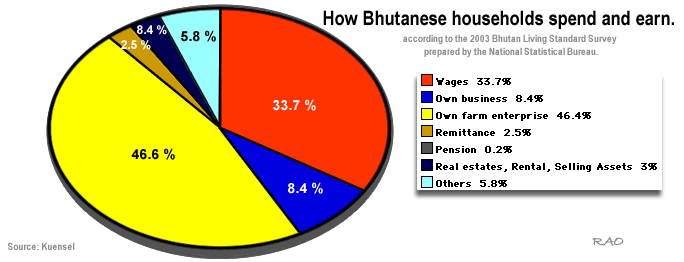
The
main sources of household income (by expenditure) were farm enterprises
and wages (including religious fees paid to monks). According to the survey,
farming was a source of income for about 46 % of the Bhutanese and salary
and wages the main income source for about 34 %.
About
8.4 % of the Bhutanese earn income though private businesses which include
small retail shops to big construction houses. Little more than 3 % earned
income through rent, real estate and selling of assets.
Remittances
as a source of income was around 2.5 % and includes money sent within the
country from the towns to the villages as well as remittances coming in
from abroad. Pensions as an income source was a meagre 0.22 %. Other sources
of income was about six percent.
The
director of the National Statistical Bureau, Kuenga Tshering, explained
that although income from farm enterprises was the major source of income
for the Bhutanese it did not mean that it was the only source of income
for a household. "It only indicates that it was the major source of income
for a majority of the Bhutanese," he explained.
According
to the survey the monthly household consumption expenditure in Bhutan
was about Nu. 7,362. In the urban areas monthly household consumption expenditure
was more than Nu. 11,100 and Nu. 6,250 in the rural areas.
 |
| Contributed
by Phuntsho Wangdi, Kuensel 2004 |
| more
information |
|
|